Tracy Profiler 0.9.1
For a more detailed change list, see https://github.com/wolfpld/tracy/blob/v0.9.1/NEWS.
Source diff when comparing traces
Compare traces menu can now display source code differences between two traces.
Improvements to assembly listings
Listings are now annotated with source line information. To improve compatibility with external tools comments are now prefixed with '#' instead of ';'.
Histogram tooltip will now also show left/right counts.
Timeline handling improvements
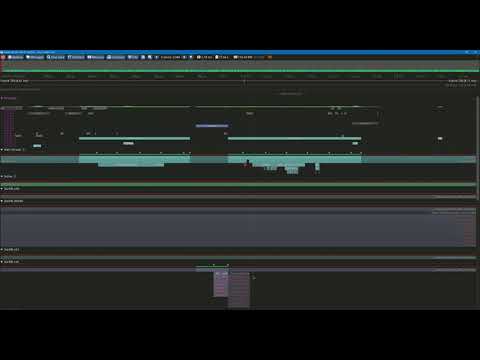
Tracy now actively manages timeline vertical scroll offset in order to keep the thread under the mouse cursor in the same place on screen.
See the following video:
Jump and call target queries
Tracy will now query jump and call target addresses. This enables discovery of target function names, even if such function has no samples and is not present in any call stack.
Instead of call 0x7ff61a5380c0 you will now more often see the following:
Native Wayland support
Tracy on Linux now targets and requires Wayland by default. Other platforms still use GLFW.
Pass LEGACY=1 parameter to make, if you want to instead rely on the GLFW library, like before.
Please don't ask about window decorations on Gnome. Current behavior is the intended behavior. Gnome does not want windows to have decorations, and Tracy respects this choice. If you find this problematic, use a desktop environment that actually listens to its users.
Privilege warning
Added warning when the profiler interface is run with privilege elevation. Advice is given to instead run the client with admin rights.


