The LogDNA AWS CloudWatch integration relies on AWS Lambda to route your CloudWatch Logs to LogDNA.
- Create a new Lambda function and select
Author from scratch - For the basic information:
- Function Name:
logdna-cloudwatch(you can choose what to name it) - Runtime:
Node.js.10.x
- Click on the lambda function to edit the details
- Code entry type:
Upload a .ZIP file - Upload our LogDNA Lambda function .ZIP File
- Handler:
index.handler - Runtime:
Node.js.10.x - Environment variables:
LOGDNA_KEY: YOUR_INGESTION_KEY_HERE (Required)LOGDNA_HOSTNAME: Alternative Host Name (Optional)LOGDNA_TAGS: Comma-separated Tags (Optional)LOGDNA_URL: Custom Ingestion URL (Optional)LOG_RAW_EVENT: Settinglineto Rawevent.message(Optional, Default: false):- It can be enabled by setting
LOG_RAW_EVENTtoYESorTRUE - Enabling it moves the following
event-relatedmetadata from thelinefield to themetafield:event.type:messageTypeofCloudWatch Logencoded insideawslogs.datainbase64event.id:idof eachCloudWatch Logencoded insideawslogs.datainbase64log.group:LogGroupwhere the log is coming fromlog.stream:LogStreamwhere the log is coming from
- It can be enabled by setting
- For Execution role, assign an IAM user with basic execution permissions by choosing an existing role and selecting a role that has permissions to upload logs to Amazon CloudWatch logs.
You have the option of connecting your AWS CloudWatch Log Groups within the Lambda function console or in your CloudWatch console.
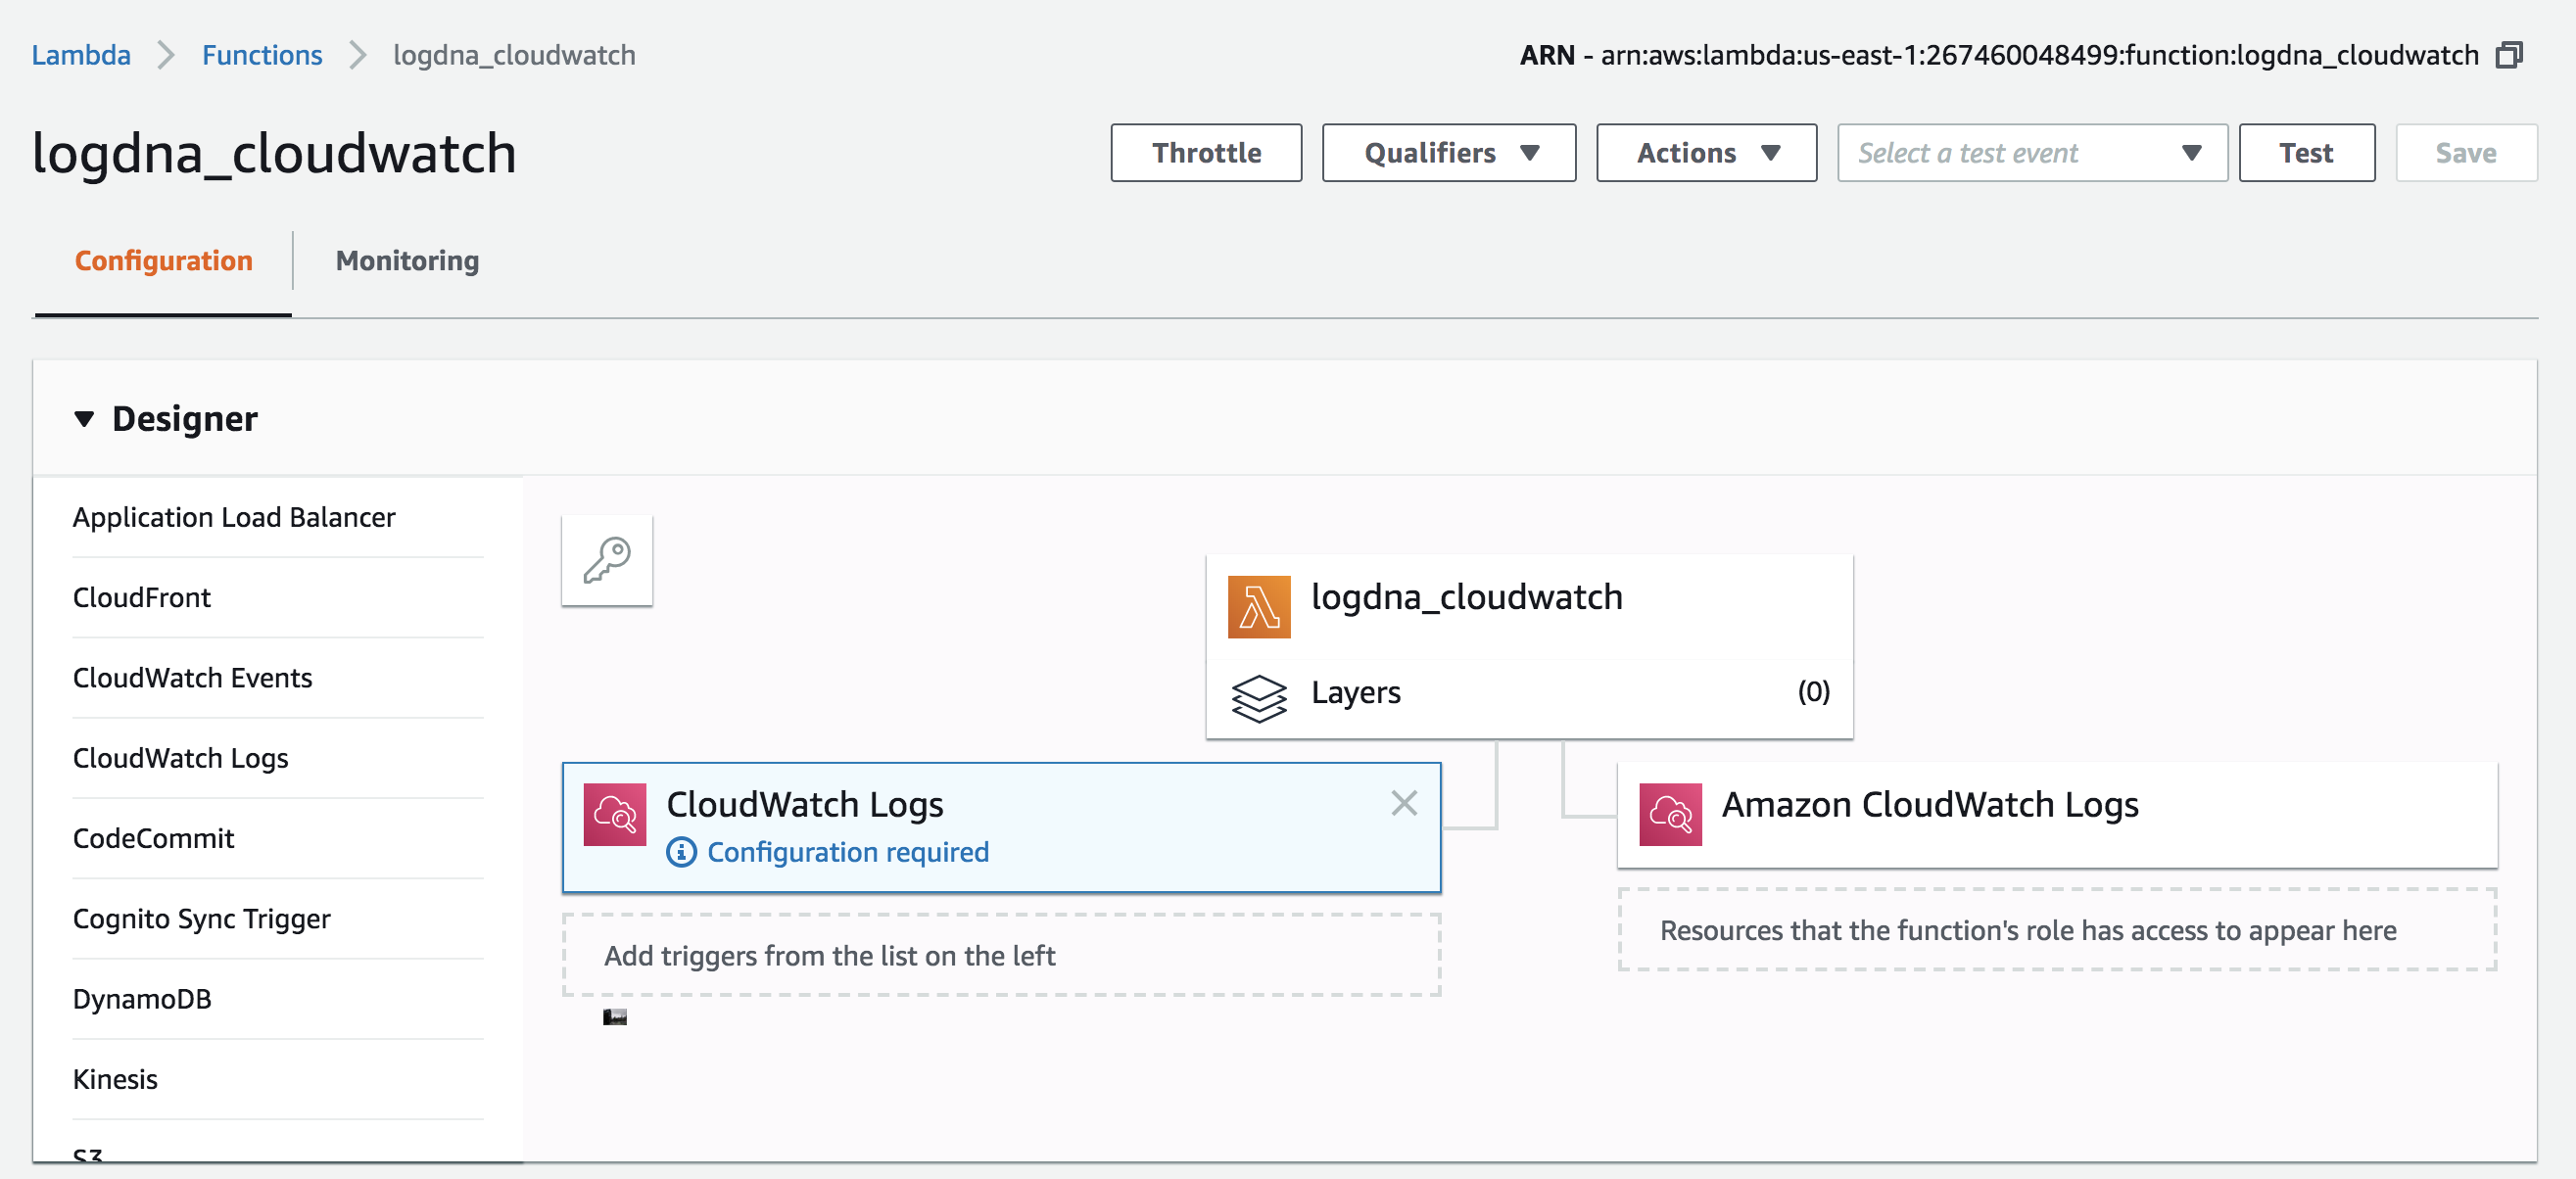
- Add CloudWatch Logs as a Trigger and click it to Configure:

- Select the CloudWatch Log Group to be sent to LogDNA
- Choose your own 'Filter name' and make sure 'Enable trigger' is checked.
- Repeat steps 1-3 to add multiple log groups.
- Select the Log Group to be sent to LogDNA
- Select the action
Stream to AWS Lambda - Choose Destination: Select the Lambda function created above, i.e.
logdna-cloudwatch - Configure Log Format and Filters: Choose JSON as a log format
- Review your settings to
Start Streaming
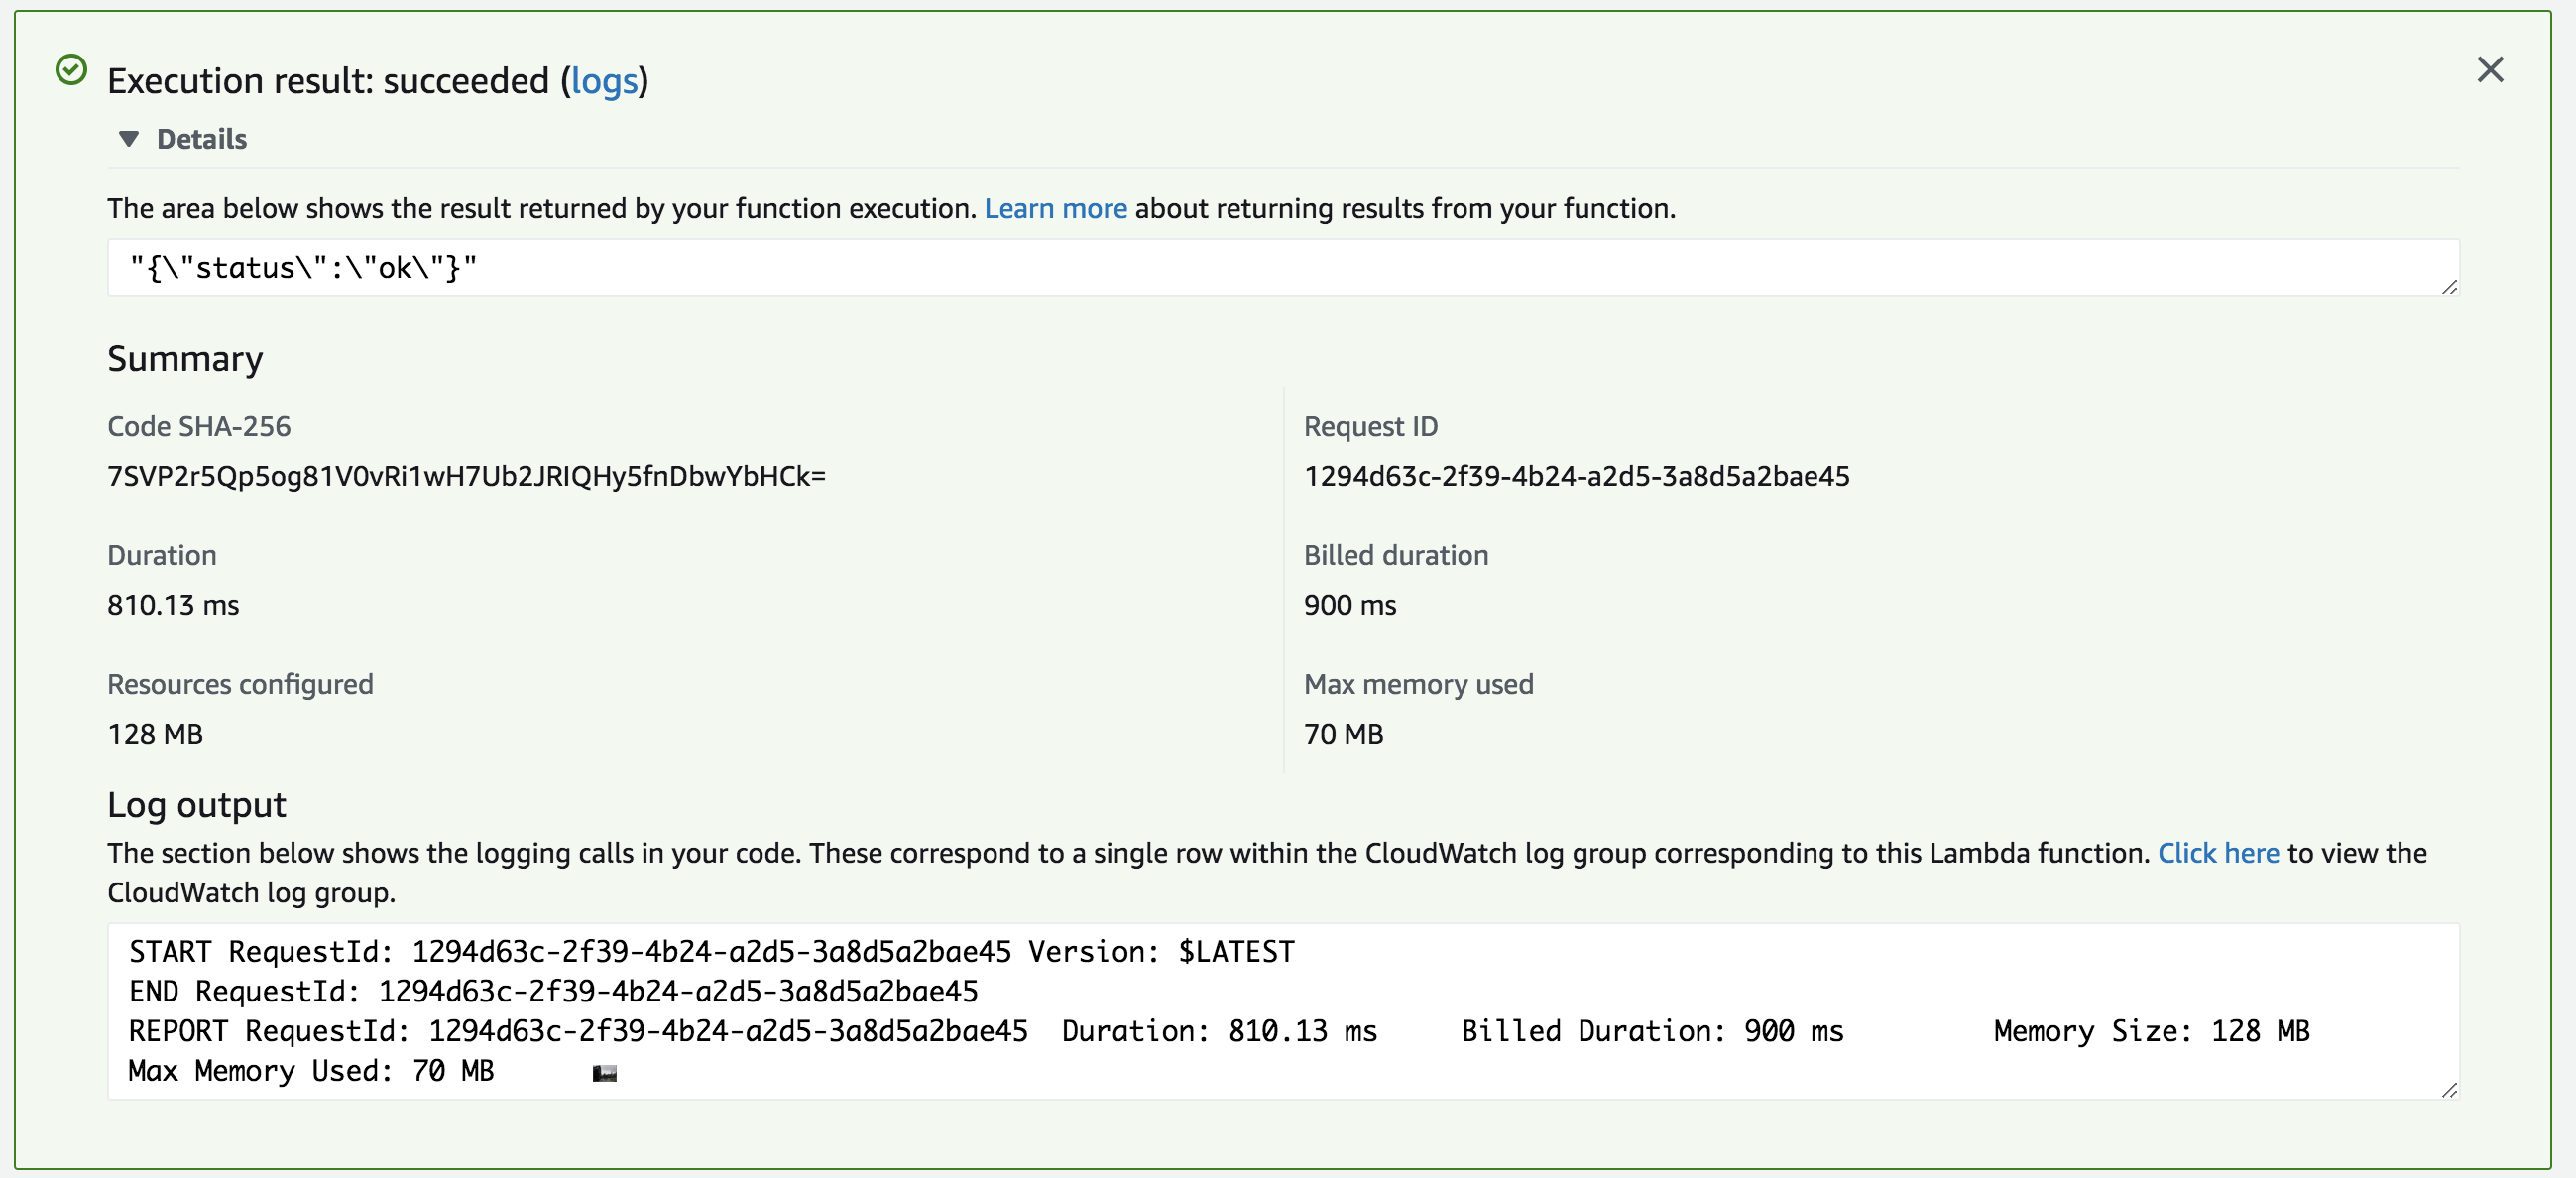
In your Lambda function console, you can configure a test event to see if your Lambda function was set up correctly:
- Select Configure test events:

- Create a new test event and select the Event template
Hello Worldand name your test - Replace the sample event data with this:
{
    "awslogs": {
        "data": "H4sIAAAAAAAAEzWQQW+DMAyF/wrKmaEkJCbhhjbWCzuBtMNUVSmkNBIQRMKqqep/X6Cb5Ivfs58++45G7ZzqdfMza5Sjt6IpTh9lXReHEsXI3ia9BJnQlHHIhMSEBnmw/WGx6xwcp8Z50M9uN2q/aDUGx2vn/5oYufXs2sXM3tjp3QxeLw7lX6hS47lTz6lTO9i1uynfXkOMe5lsp9Fxzyy/9eS3hTsyXYhOGVCaEsBSgsyEYBkGzrDMAIMQlAq+gQIQSjFhBFgqJOUMAog34WAfoFFOOM8kA0Y5SSH+f0SIb67GRaHq/baosn1UmUlHF7tErxvk5wa56b2Z+iRJ0OP4+AWj9ITzSgEAAA=="
    }
}
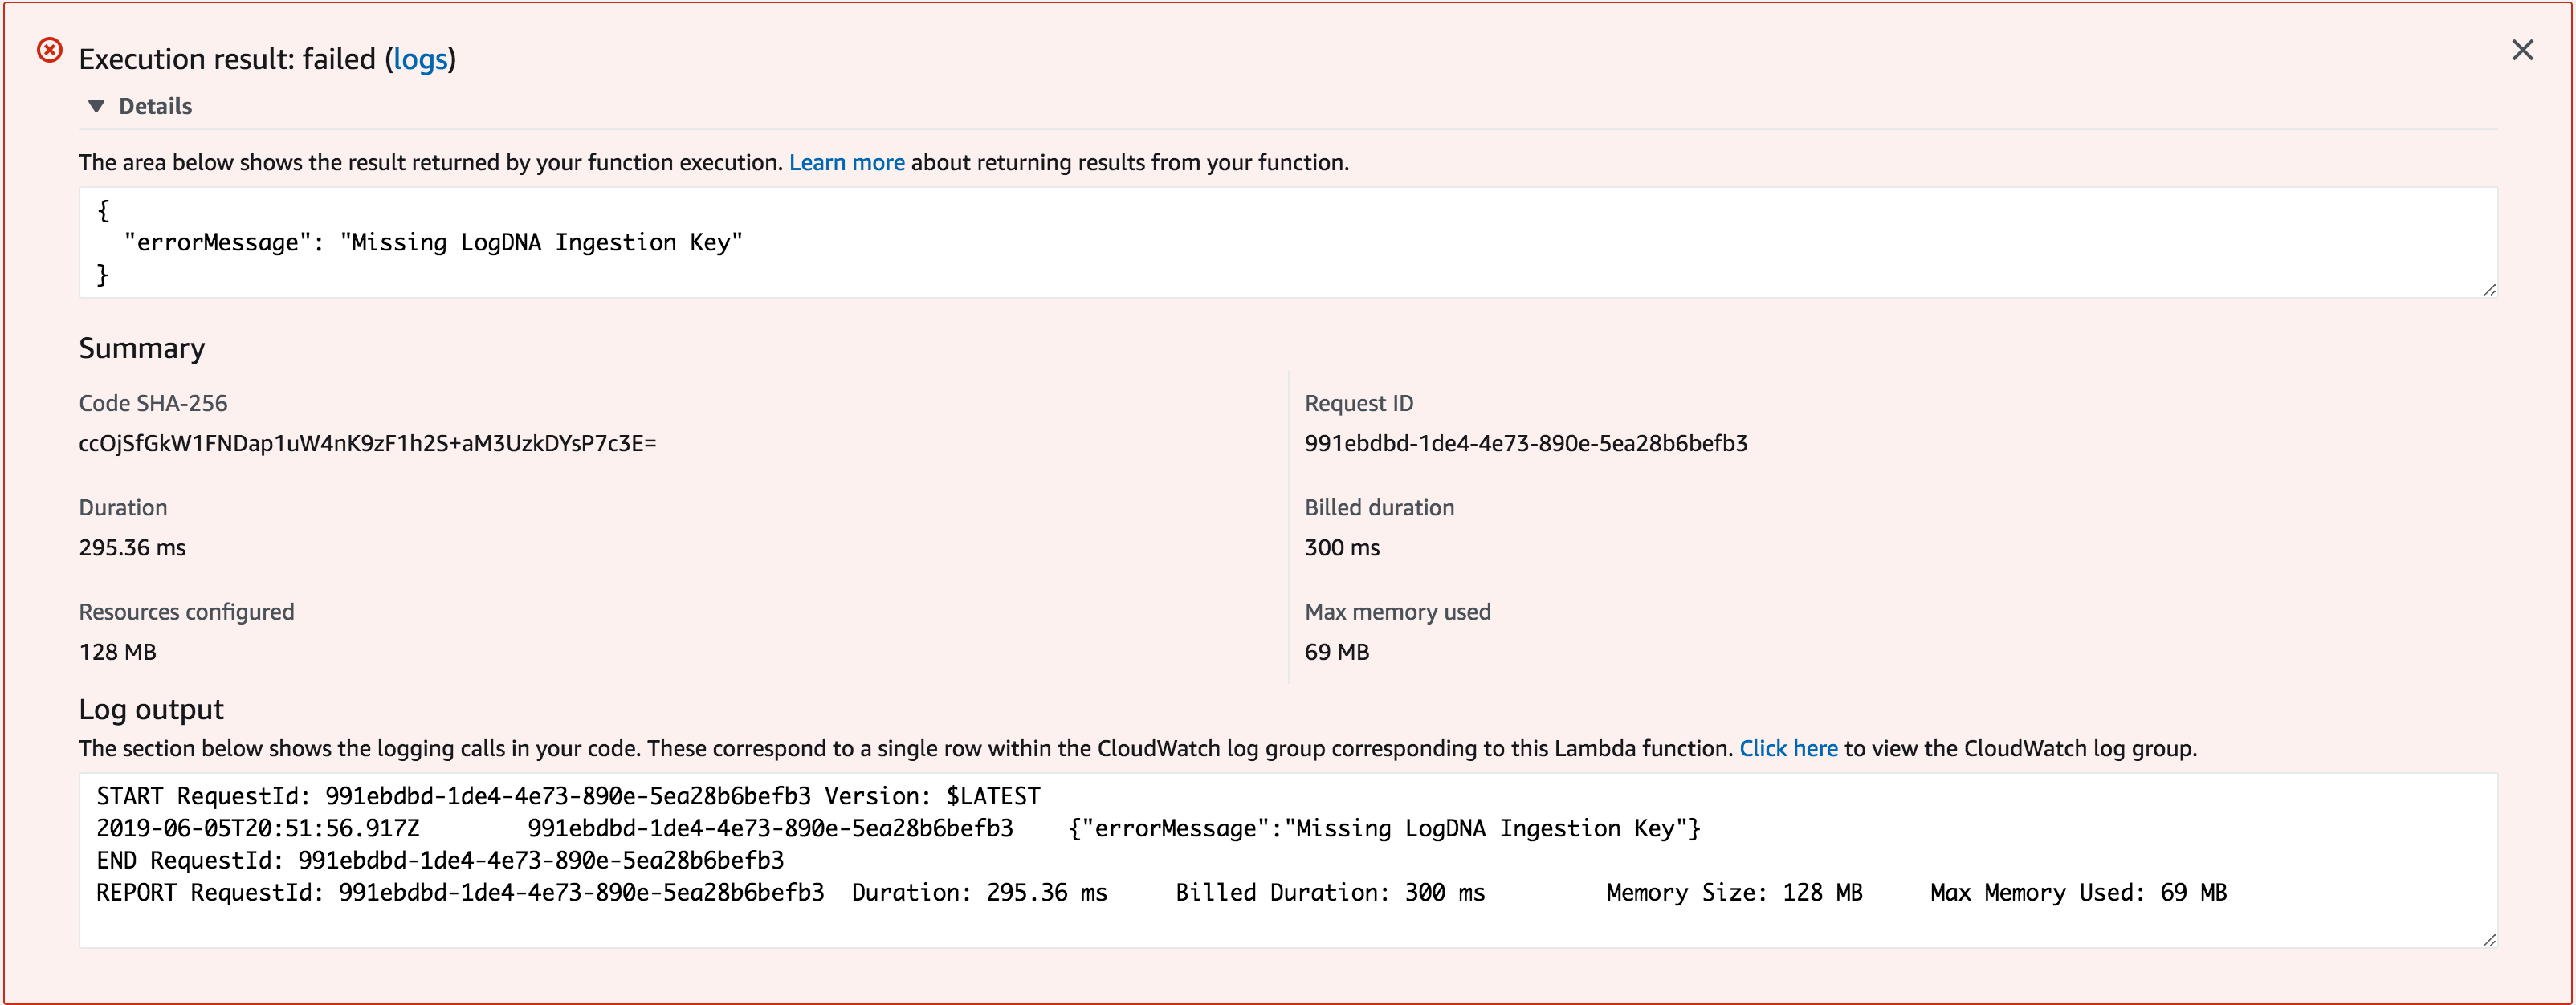
If you see errors, the most common one is not adding in the ingestion key in the environment variables:

- Log in to your LogDNA console to see the log line from your Lambda function test:

The following variables can be used to tune this Lambda function for specific use cases.
- LOGDNA_MAX_LINE_LENGTH: The maximum character length for each line, Optional
- Default: 32000
- LOGDNA_MAX_REQUEST_TIMEOUT: Time limit (in
milliseconds) for requests made by this HTTP Client, Optional- Default: 30000
- LOGDNA_FREE_SOCKET_TIMEOUT: How long (in
milliseconds) to wait for inactivity before timing out on the free socket, Optional- Default: 300000
- Source: agentkeepalive#agentoptions
- LOGDNA_MAX_REQUEST_RETRIES: The maximum number of retries for sending a line when there are network failures, Optional
- Default: 5
- LOGDNA_REQUEST_RETRY_INTERVAL: How frequently (in
milliseconds) to retry for sending a line when there are network failures, Optional- Default: 100
Contributions are always welcome. See the contributing guide to learn how you can help. Build instructions for the agent are also in the guide.
