-
-
Notifications
You must be signed in to change notification settings - Fork 1
/
Copy pathday22_boundaries.py
179 lines (158 loc) · 6.03 KB
/
day22_boundaries.py
1
2
3
4
5
6
7
8
9
10
11
12
13
14
15
16
17
18
19
20
21
22
23
24
25
26
27
28
29
30
31
32
33
34
35
36
37
38
39
40
41
42
43
44
45
46
47
48
49
50
51
52
53
54
55
56
57
58
59
60
61
62
63
64
65
66
67
68
69
70
71
72
73
74
75
76
77
78
79
80
81
82
83
84
85
86
87
88
89
90
91
92
93
94
95
96
97
98
99
100
101
102
103
104
105
106
107
108
109
110
111
112
113
114
115
116
117
118
119
120
121
122
123
124
125
126
127
128
129
130
131
132
133
134
135
136
137
138
139
140
141
142
143
144
145
146
147
148
149
150
151
152
153
154
155
156
157
158
159
160
161
162
163
164
165
166
167
168
169
170
171
172
173
174
175
176
177
178
179
# -*- coding: utf-8 -*-
# ---
# jupyter:
# jupytext:
# formats: ipynb,py:hydrogen
# text_representation:
# extension: .py
# format_name: hydrogen
# format_version: '1.3'
# jupytext_version: 1.9.1
# kernelspec:
# display_name: Python 3 (ipykernel)
# language: python
# name: python3
# ---
# %% [markdown]
# # Day 22 : Boundaries
#
# Boundaries are all around us.
# Some of them are visible and some of them are in our heads.
# %%
import numpy as np
import pandas as pd
import pygmt
import rioxarray
import xarray as xr
# %% [markdown]
# ## Download ICESat-2-derived grounding zone product for Antarctica
#
# This dataset derived from Ice, Cloud, and land Elevation
# Satellite 2 (ICESat-2) laser altimetry ATL06 Land Ice Height
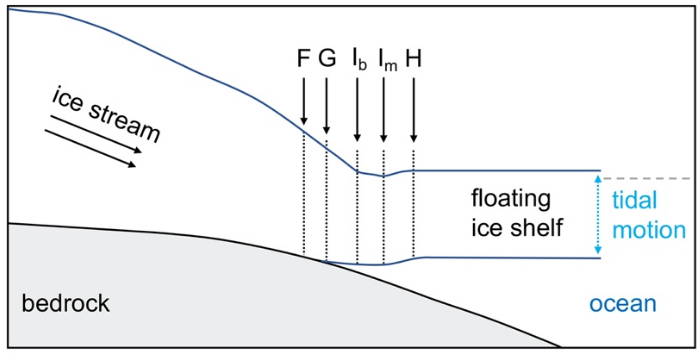
# product includes 3 points along the grounding zone:
#
# - the landward limit of tidal flexure (Point F)
# - the break-in-slope (Point I_b)
# - the inshore limit of hydrostatic equilibrium (Point H)
#
# 
#
# References:
# - Li, T., Dawson, G., Chuter, S., & Bamber, J. (2021). ICESat-2-derived grounding zone product for Antarctica. University of Bristol. https://doi.org/10.5523/BRIS.BNQQYNGT89EO26QK8KECKGLWW
# - Li, T., Dawson, G., Chuter, S., & Bamber, J. (2021). A High-Resolution Antarctic Grounding Zone Product from ICESat-2 Laser Altimetry [Preprint]. Cryosphere – Glaciology. https://doi.org/10.5194/essd-2021-255
# %%
df_F = pd.read_csv(
filepath_or_buffer="https://data.bris.ac.uk/datasets/bnqqyngt89eo26qk8keckglww/ICESat2_F.csv"
)
df_I = pd.read_csv(
filepath_or_buffer="https://data.bris.ac.uk/datasets/bnqqyngt89eo26qk8keckglww/ICESat2_I.csv"
)
df_H = pd.read_csv(
filepath_or_buffer="https://data.bris.ac.uk/datasets/bnqqyngt89eo26qk8keckglww/ICESat2_H.csv"
)
# %%
print(df_H.head())
# %%
print(len(df_F), len(df_I), len(df_H))
# %% [markdown]
# ## Download and preprocess Sentinel 3 OLCI imagery
#
# Getting optical imagery from the [Sentinel-3](https://en.wikipedia.org/wiki/Sentinel-3)
# Ocean and Land Colour Instrument (OLCI) sensor! Link at EO Browser is:
#
# - https://apps.sentinel-hub.com/eo-browser/?zoom=8&lat=-82.50379&lng=-153.1604&themeId=DEFAULT-THEME&visualizationUrl=https://services.sentinel-hub.com/ogc/wms/82f84fab-9b1c-4322-beeb-207b0f05afef&datasetId=S3OLCI&fromTime=2021-11-21T00:00:00.000Z&toTime=2021-11-21T23:59:59.999Z&layerId=6_TRUE-COLOR-HIGLIGHT-OPTIMIZED&gain=0.9&gamma=2
#
# Note that the contrast stretching for Sentinel-3 OLCI is a bit more finicky
# than Sentinel-2, so no guaranteees that this works for other areas!
# %%
band8 = rioxarray.open_rasterio(
filename="https://meeo-s3-cog.s3.amazonaws.com/NRT/S3A/OL_1_EFR___/2021/11/21/S3A_OL_1_EFR____20211121T155938_20211121T160238_20211121T172515_0179_079_011_4320_MAR_O_NR_002_Oa08_radiance.tif",
masked=True,
# overview_level=1,
)
band8["band"] = 8 * band8.band
band6 = rioxarray.open_rasterio(
filename="https://meeo-s3-cog.s3.amazonaws.com/NRT/S3A/OL_1_EFR___/2021/11/21/S3A_OL_1_EFR____20211121T155938_20211121T160238_20211121T172515_0179_079_011_4320_MAR_O_NR_002_Oa06_radiance.tif",
masked=True,
# overview_level=1,
)
band6["band"] = 6 * band6.band
band4 = rioxarray.open_rasterio(
filename="https://meeo-s3-cog.s3.amazonaws.com/NRT/S3A/OL_1_EFR___/2021/11/21/S3A_OL_1_EFR____20211121T155938_20211121T160238_20211121T172515_0179_079_011_4320_MAR_O_NR_002_Oa04_radiance.tif",
masked=True,
# overview_level=1,
)
band4["band"] = 4 * band4.band
# %%
# Stack the Red (4), Green (3) and Blue (2) bands together
# Note, slightly increasing the intensity of band6 to avoid image looking purple
band864 = xr.concat(objs=[band8, band6 * 1.25, band4], dim="band")
# %%
# Clip Sentinel 2 imagery to geographical extent of Kamb Ice Stream
b864 = band864.rio.clip_box(minx=-156, maxx=-150, miny=-82.8, maxy=-81.8)
# %%
# Highlight Optimized Natural Color
# https://custom-scripts.sentinel-hub.com/sentinel-3/true_color_highlight_optimized/
b864_highlight = np.sqrt(0.9 * b864 - 0.055)
# Normalize to 8-bit color range
b864_kamb = (
(b864_highlight - b864_highlight.min())
/ (b864_highlight.max() - b864_highlight.min())
) * 2 ** 8
# %%
(b864_kamb / 2 ** 8).plot.imshow(rgb="band")
# %%
# Save preprocessed Sentinel 3 image to a GeoTIFF file
b864_kamb.rio.to_raster(raster_path="B864_Kamb.tif", dtype="uint8")
# %%
# Inspect the GeoTIFF file's metadata
print(pygmt.grdinfo(grid="B864_Kamb.tif"))
# %% [markdown]
# ## Plot the map!
#
# Time to map this up! We'll use PyGMT's
# [`grdimage`](https://www.pygmt.org/v0.5.0/api/generated/pygmt.Figure.grdimage.html)
# to lay down the Sentinel 3 imagery, and plot the ICESat-2 derived grounding
# points symbolized based on their type (H, I, F).
# %%
fig = pygmt.Figure()
# Background Sentinel 3 OLCI image
with pygmt.config(
PS_PAGE_COLOR="black",
MAP_ANNOT_OFFSET_PRIMARY="-2p",
MAP_FRAME_TYPE="plain",
FONT_ANNOT_PRIMARY="10p,grey",
MAP_GRID_PEN_PRIMARY="grey",
MAP_TICK_PEN_PRIMARY="thinnest,grey",
):
fig.grdimage(
grid="B864_Kamb.tif",
img_in="r",
region=[-156, -150, -82.8, -81.8],
projection="EPSG:3031",
frame=["NsWe", "xa2fg2", "ya0.25fg0.25"],
)
# Add a scalebar
fig.basemap(map_scale="g-155.35/-81.86+w10k+uk+f")
# Plot grounding points
for letter, color, df in [
("H", "#1b9e77", df_H), # Point H in green
("I", "#d95f02", df_I), # Point I in orange
("F", "#7570b3", df_F), # Point F in purple
]:
# Subset to locations inside region of interest
_df = pygmt.select(data=df[["lon", "lat"]], region=[-156, -150, -82.8, -81.8])
# Plot the data points as coloured circles
fig.plot(
x=_df.lon,
y=_df.lat,
pen=f"thin,{color}",
style="c0.06c",
color="white",
label=f'"Point {letter}"',
)
# Add legend on bottom left corner
with pygmt.config(FONT_ANNOT_PRIMARY="12p,grey"):
fig.legend(position="JBL+jBL+o1.5c/2.5c", S=3)
fig.savefig(fname="day22_boundaries.png")
fig.show()