A JavaScript library to find the intersection of two straight lines (useful for charting libraries). Also includes a function that generate trendline from a chart data.
Written originally for highcharts but can work with any charting library as long as they support line data in the format
[[x1, y1], [x2, y2], ... ] such as Flot, PlotKit, JS Charts etc.
For other libraries, you will need to convert the data to this form and back after getting the intersection data.
-
getLineIntersectionData(line1_data, line2_data, user_options)
Given two straight line data each of the form
[[x1, y1], [x2, y2], ... [xn, yn]]this method will return an object that contains the intersection points and two "new line data" with the intersection point added. (Does not modify the input data!)If your data is not from a straight line but some chart data, use
getTrendlineDatato generate a straight trendline out of that data using Linear Regression. -
getTrendlineData(data)
Given any linear chart data of the form
[[x1, y1], [x2, y2], ... [xn, yn]]this method will generate a straight trendline using linear regression.
Documentation
/**
 * @param line1_data - Mandatory argument that contains the data of line1 of the form
 *                      [[x1, y1], [x2, y2], ... [xn, yn]]
 *
 * @param line2_data - Mandatory argument that contains the data of line2 of the form
 *                      [[x1, y1], [x2, y2], ... [xn, yn]]
 *
 * @param user_options - Optional argument that is an object containing custom options that overrides the default
 *                      behavior of the method. Refer the comments for each option in the opt object for the valid
 *                      values for that option.
 *
 * @returns
 * > an object with the following properties
 *     icptX - The intersection point X
 *     icptY - The intersection point Y
 *     line1_data - The new line1 data with intersection point added
 *     line2_data - The new line2 data with intersection point added
 * > or returns undefined
 *     if the lines are parallel,
 *     if any of the first two arguments are not in the form [[x1, y1], [x2, y2], ... [xn, yn]]
 *     if any of the line data has less than 2 points (it's not a line then)
 *     if the user_options argument or any of the options inside it is not in the required format
 *     if any callback set in user_options returns false
 */
Basic example
var line1 = [[0, 1], [2, 1]];
var line2 = [[1, 0], [1, 2]];
var forecast = getLineIntersectionData(line1, line2);
JSON.stringify(forecast)
>> {"icptX": 1, "icptY": 1, "line1_data": [[0,1],[1,1],[2,1]], "line2_data": [[1,0],[1,1],[1,2]]}
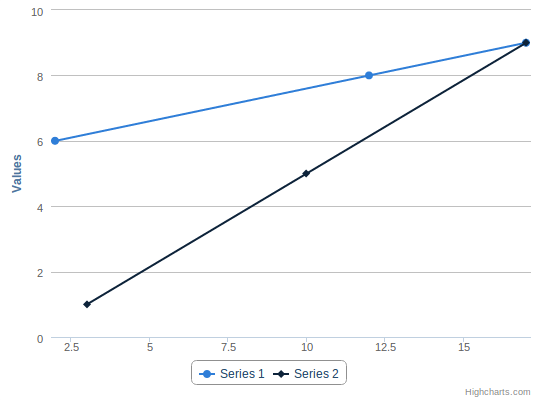
Example with chart
jQuery(function () {
    var data1 = [[2, 6], [12, 8]];
    var data2 = [[3, 1], [10, 5]];

    var forecast = getLineIntersectionData(data1, data2);

    var chart_linear = new Highcharts.Chart({
        chart: {
            renderTo: 'container'
        },
        series: [{
            //getLineIntersectionData() may return undefined if lines can not intersect
            data: forecast && forecast.line1_data || data1
        }, {
            data: forecast && forecast.line2_data || data2
        }]
    });
});
Output:
The code and this example were extracted from highcharts_trendline
Documentation
/**
 * @param data - Mandatory argument that contains the chart data of the form
 *                 [[x1, y1], [x2, y2], ... [xn, yn]]
 *
 * @returns an object containing the following properties
 *      data - new array containing the data for the straight trendline
 *      slope - slope of the trendline
 *      intercept - intercept of the trendline
 *
 */
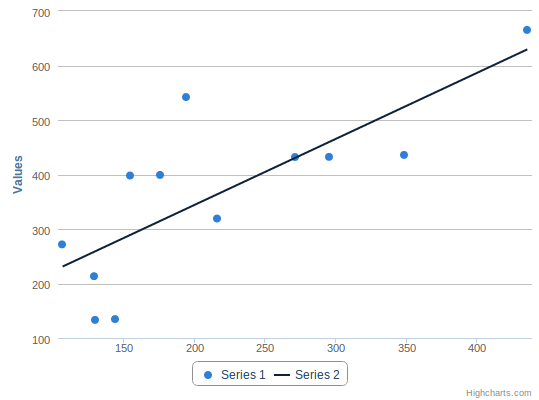
Example
jQuery(function () {
    // E.g. source data
    var sourceData = [
        [106.4, 271.8], [129.2, 213.4],
        [295.6, 432.3], [154.4, 398.1],
        [129.9, 133.2], [271.5, 432.1],
        [144.0, 134.7], [176.0, 399.2],
        [216.4, 319.2], [194.1, 542.1],
        [435.6, 665.3], [348.5, 435.9]
    ];

    var chart_linear = new Highcharts.Chart({
        chart: {
            renderTo: 'container'
        },
        series: [{
            type: 'scatter',
            data: sourceData
        }, {
            marker: {
                enabled: false
            },
            /* function returns data for trend-line */
            data: getTrendlineData(sourceData).data
        }]
    });
});
Output:
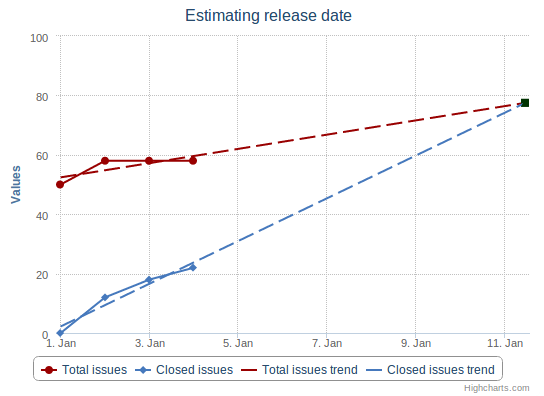
Example using both methods
jQuery(function () {
    var data1 = [
        [Date.UTC(2013, 0, 1), 50],
        [Date.UTC(2013, 0, 2), 58],
        [Date.UTC(2013, 0, 3), 58],
        [Date.UTC(2013, 0, 4), 58]
    ];
    var data2 = [
        [Date.UTC(2013, 0, 1), 0],
        [Date.UTC(2013, 0, 2), 12],
        [Date.UTC(2013, 0, 3), 18],
        [Date.UTC(2013, 0, 4), 22]
    ];
    var data1_t = getTrendlineData(data1).data;
    var data2_t = getTrendlineData(data2).data;
    var options = {
        icptPoint: {
            //name: 'Possible release date',
            marker: {
                enabled: true,
                fillColor: '#003300',
                lineColor: '#003300'
            }
        },
        validateIntersection: function(icptX, icptY) {
            // Don't connect the lines if the intersection point is
            // to the left of the chart
            if (icptX < data1_t[0][0] || icptX < data2_t[0][0]) {
                return false;
            }
        }
    };
    var forecast = getLineIntersectionData(data1_t, data2_t, options);

    var chart_linear = new Highcharts.Chart({
        chart: {
            renderTo: 'container'
        },
        colors: ['#990000', '#4679BD', '#990000', '#4679BD'],
        xAxis: {
            type: 'datetime',
            gridLineWidth: 1,
            gridLineDashStyle: 'shortdot'
        },
        yAxis: {
            min: 0,
            gridLineDashStyle: 'shortdot'
        },
        title: {
            text: 'Estimating release date'
        },
        series: [{
            name: 'Total issues',
            data: data1
        }, {
            name: 'Closed issues',
            data: data2
        }, {
            name: 'Total issues trend',
            //getLineIntersectionData() may return undefined if lines can not intersect
            data: forecast && forecast.line1_data || data1_t,
            marker: {
                enabled: false
            },
            dashStyle: 'longDash'
        }, {
            name: 'Closed issues trend',
            data: forecast && forecast.line2_data || data2_t,
            marker: {
                enabled: false
            },
            dashStyle: 'longDash',
        }]
    });
});
Output:
See live demo for this chart here
##Tests Live unit tests available here
##Credits
- virtualstaticvoid/highcharts_trendline - The getTrendlineData method is extracted from this library which itself extracted code from jqplot.trendline.js
- John Kiernander - for giving me a groundwork that inspired me to do this
- Wikipedia - for the line intersection formula


